Last week, another national report was released covering the national chronic and epidemic illness of urban flooding. The report is titled “Urban Flooding Moving Towards Resilience” and was released by the Association of State Floodplain Managers Foundation. Click here if you care to read the full report. I’m going to post my personal highlights and commentary on the report below.
While the focus of the Pittsburgh Urban Flooding Journal is Pittsburgh centered (well duh it’s in the title of the blog, Tom), it’s important to keep an eye on the national landscape to better understand and learn perspectives from other places across the country.
You may recall a past blog post where I wrote (in David Letterman style) about another national report titled: “The Growing Threat of Urban Flooding: A National Challenge”. Boy, did I really enjoy doing that whole David Letterman bit around that report. But let’s be honest I’m no David Letterman, even though I desperately want to be. David, if you are reading this, which I realize you are not, but will pretend you are anyway, you are a true American hero. For example, you deserve this country’s highest medal of honor, not that jackass Rush Limbaugh, for this skit when you were the manager at the local Taco Bell taking orders in the drive thru. Not in this or any parallel universe can I compete with that level of comedy on this blog.
“Nacho Supreme takes about an hour and a half. You need to give us a day’s notice on that one.”
But enough about David Letterman, I wanted to discuss some of the highlights from the report “Urban Flooding Moving Towards Resilience” and provide some reflections and commentary from a Pittsburgh perspective. So let’s get to it. Passages from the report in bold. Commentary in italics.
Pg. 7 (of the pdf): “Local action alone is not enough. Resilience requires coordinated action across multiple domains and multiple levels of government.”
This passage from the report should pretty much be the official motto for this blog. Individual municipalities in the Pittsburgh region need to come together. Right now…. ♫Over me. He got early warning. He got muddy water. ♫
Pg. 7:Ugh… Not this photograph again…
Well well well we meet again flooding bike kid and lackadaisical adult supervision guy wearing mesh basketball shorts. See my prior blog post offering my commentary on the lunacy of this photo.
Pg. 8: “We need to better understand urban flooding: where, how and why it is taking place, and the social, environmental, economic and cultural impacts. Detailed data and strong visualizations can help.”
Motto number 2 for why this blog exists.
Pg. 9: ” GIS maps can detail where flooding is likely to occur … Heat maps can show “hot spots” for reported flooding—for example, the locations of 311 calls over time.”
Stay tuned to this blog for more on this idea of determining hot spots. I’m using twitter data and GIS tools to map flooding report locations throughout Allegheny county.
Pg. 10: “A mayor’s committee, a task force structure or special authorization may be needed.”
Pg. 11: “Throughout the country, multi-agency and multi-jurisdictional coalitions are being formed to discuss shared water concerns and create common standards and programs.”
Yes and this needs to happen in the Pittsburgh Region.The report highlights Denver as an example. The Mile High Flood District is a great example that the Pittsburgh region should use as a potential model agency.
Pg. 19: In Washington DC “The mayor set up a Task Force on Prevention of Flooding to find solutions that could be implemented through coordinated efforts over time”
“The first step in fixing a problem is admitting you have one.”
Way to go Mr. Mayorin taking this first step.We need a similar type of leader in the Pittsburgh region to do the same. “Pittsburgh Regional Flood Commission” drum beating noises emanating from my Fraggle Rock drum set.
And finally my favorite line from the report from Page 24 …
“The path to the future starts with community commitment. But the path can be made easier through focused support.”
We need community commitment and focused support in the Pittsburgh region to address our chronic flooding illness. The only way this can be done is if we come together.
Right now...
Here’s a photo of John and Ringo spending a relaxing day fishing…
If you’ve been reading this blog you should know by now that I have deep insatiable desire for numbers, math, coding, engineering, making colorful interactive maps, David Letterman top ten lists and Seinfeld episodes. I also really enjoy reading great non-fiction history and biographical writing. Writings that peel off the external layers of the onion and perform deep examinations of great human beings and achievements. Writings that examine why things are the way they are. “The farther back you can look, the farther forward you are likely to see.”
BTW, I know what you are thinking, and no this is not a picture of me, nor is it a close approximation:
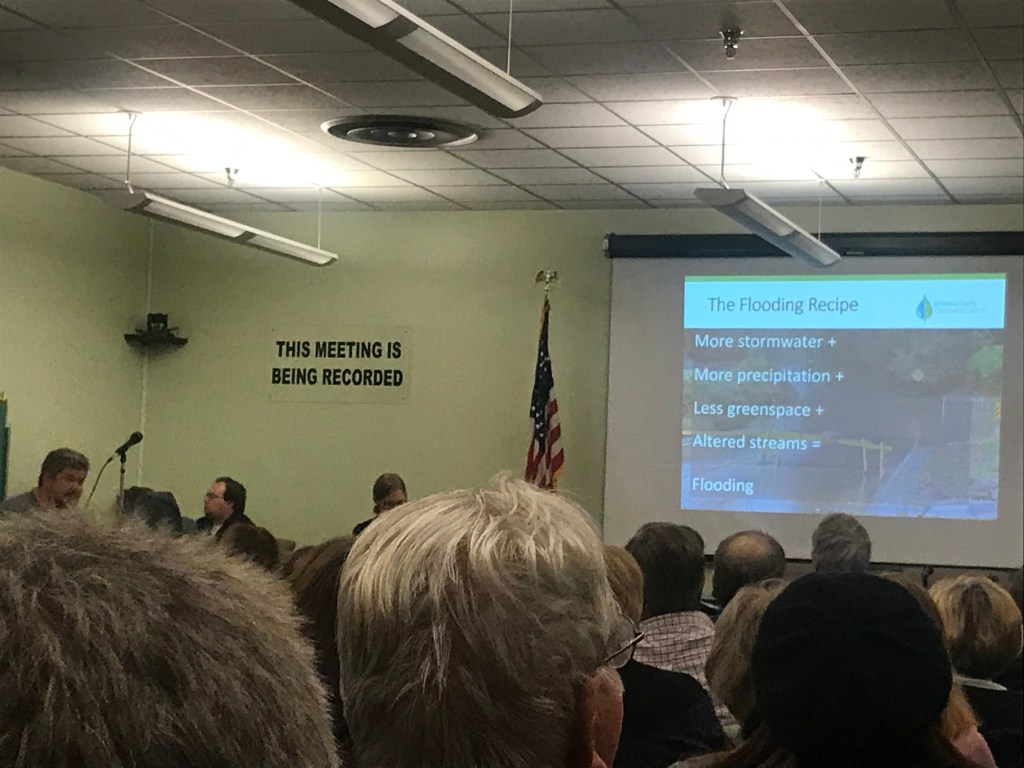
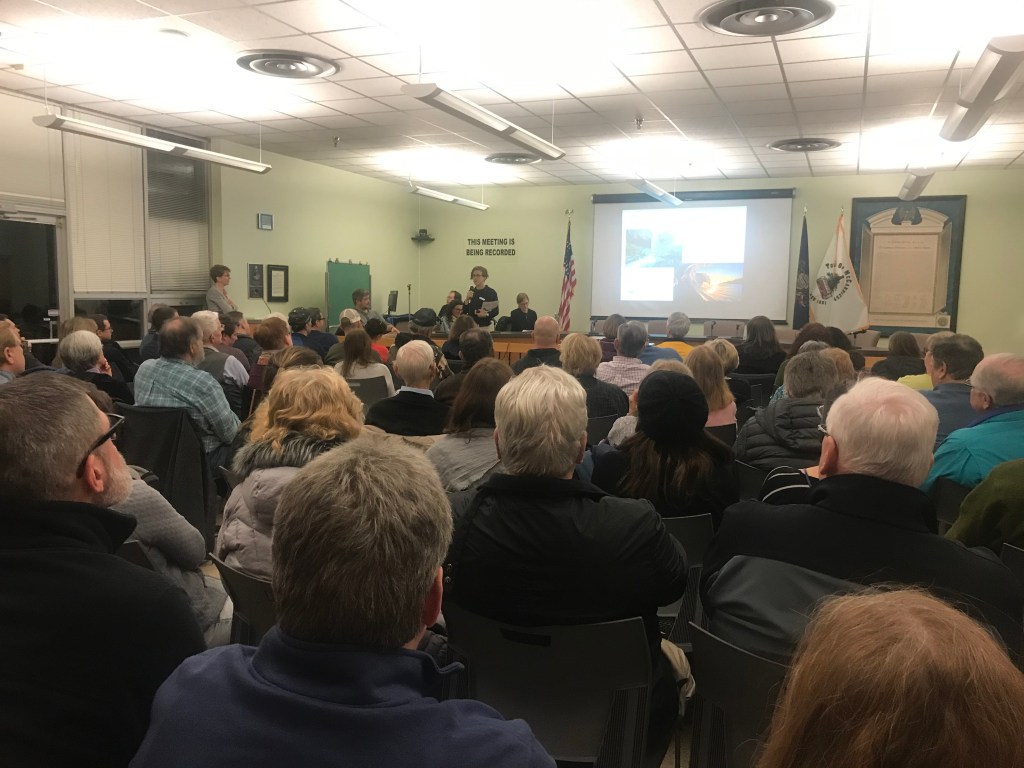
The meeting was packed. Over 100 people were there, every seat was filled in a standing room crowd.
During the audience Q&A portion, a local farmer in attendance made the following comment that I immediately jotted down into my phone:
“Stormwater management in our region is a failure and has been going back to the 1970s. Problem is the over development and mismanagement of water resulting from the development. We got problems and we need corrections.”
He was right on the money, direct bulls eye with everything he said, of course.
But his comment touches upon something deeper. That present day flooding problems have been a long time in the making. We didn’t get to where we are overnight or even in the past ten years. We humans have been stewing the pot on a low slow simmer for decades, centuries even, when it comes to increasing our flooding risk. Like a nice Sunday sauce that your sweet Italian Grandma Florentina makes after returning home from Sunday morning mass.
If you’re not of Italian descent or Catholic just pretend, OK. I need you to cooperate and participate in this metaphor.
What a belt, kid.
The tomatoes, onions, garlic and peppers have been crushed, chopped and diced into a nice sauce. Veal, pork ribs, meatballs have been added. Everything has been on a low simmer for a couple hours releasing all of that succulent meat flavoring and artery clogging fat into the sauce. So good.
This is where things take a turn.
Mistakingly, Grandma Flo with her slight onset dementia has now set the gas range on full blast high thinking she was searing last nights steaks.
Oh no, Grandma Flo has now slipped and taken a fall from a rogue tomato peel and is lying incapacitated on the floor! She’s trying to muster whatever last strength she has left to push the button on her necklace but the Life Alert service guy is asleep on the job. Meanwhile you’re in the backyard running around playing with the dog and climbing trees like the carefree kid that you are.
Now that delicious Sunday sauce is beginning to flood the pot and making a mess splattering all over Grandma’s retro 70’s kitchen wallpaper and linoleum floors and countertops.
But how did the sauce go from a low simmer with such a brilliant red color to a big giant mess with Grandma Flo lying dead on the floor?
Just to be clear the Sunday sauce on the stove is the metaphor for flooding. You all get it right? And Grandma Flo is all of us. Or are we the oversized giant belt kid in the backyard oblivious of the whole situation, I forget. Maybe we are both? It doesn’t really matter.
But Granny Flo ain’t dead yet! I think I heard a slight groan. The Life Alert guy has woken up from his hangover: “Don’t worry. The ambulance is on its way, mam.”
I want to talk about how we got here, lying incapacitated on the kitchen floor, in a future series of blog posts. I’m going to try to paint the history of modern flooding and why it seems to be worse than ever before. Why the pot has gone from a low gentle simmer to a raging boil.
It seems as though climate change and increasing rains has gotten most of the attention in the press lately, which is certainly playing a role in the flooding. But to me there are several other reasons that go much deeper than the increasing rainfall we’ve been experiencing. To me, the story begins all the way back to the founding of the early colonies and the United States when the first settlers from Europe set foot on this continent.
It’s long story that I’m going to try to write over the next few months so I’m going to break it up into parts. I’m going to try to peel back the layers of the onion, chop it up, and simmer it with some garlic and olive oil for Grandma Flo’s sauce.
Part 1 will cover the European settlement of North America and the mass harvesting of trees.
Part 2 will cover the history of railroads, industry and coal mining.
Part 3 will cover the invention of the automobile and post war suburban expansion.
Part 4 will cover modern day environmentalism, climate change, and changing rainfall patterns.
In my opinion, all of these issues play a role in modern day flooding in the Pittsburgh region and why things are the way they are today. It’s a story that we all need to understand so that we can maybe develop a future remedy.
The farther back you can look, the farther forward you are likely to see. Those that are ignorant of the past are doomed to repeat it. You’ve got to know where you’ve been in order to know where you’re going. History and context is important.
Just a fair warning, it might be a little while before I can get to do all of these parts. I have a rough outline in my head how each of them is going to go. I do this blog all for fun on the side when I’m not doing my “real job.”
I’m hoping by the end of the year I will have covered all the parts.
So stay with me! Life Alert is here, you’re on the stretcher and on the way to the hospital Granny Flo! Subscribe on the front page!
Good news, this blog was featured in an article last week published by Public Source and Environmental Health News about the challenges of regional flooding. If you have not read it yet, get busy doing so. It’s great. Click here or here.
I think it goes without saying, and obvious to all, that press coverage is vitally important. The press can help unknown semi-insignificant people (e.g. me) spread their message to a larger audience. And just maybe, if that content gets into the hands of the right people, lasting positive change can occur.
Bottom line, without the press I may as well just save up my complaints for the annual “Airing of Grievances” and tell them to Frank Costanza’s aluminum pole.
“I got a lot of problems with you people.”
Just take a minute and think about about all the major changes in the history of this country. At the heart of these changes are the courage of individuals. But at the soles of their feet, at the foundation, are the press. The press give their message traction by helping spread awareness which can then snowball into larger movements.
It’s of no surprise that the highest amount of traffic to date to this blog has occurred in the days since Public Source and Environmental Health News published the article. Also, the number of new subscribers to the blog increased by a whopping 50%.*
It’s vital to have actual professional journalists helping spread the word on the issue of systematic and chronic flooding in the Pittsburgh region. Make no mistake about it, I don’t pretend to be a journalist and never will. And only sometimes I would consider myself even “professional.” That’s why you have a Seinfeld reference at the beginning of this blog post.
I’d like to thank Oliver Morrison, Public Source, and Environmental Health News in taking the time to increase the spotlight on this issue, lending it credence, and giving it the professional coverage that it deserves. I would highly encourage everyone, if you can financially, to make a regular monthly donation to Public Source and Environmental Health News. They are doing great work. Check out Good River: Stories of the Ohio in which both news outlets are a contributors. It’s fantastic. I especially liked 360 degrees of the Cheat River: A journey to revitalization on an Ohio River tributary.
In addition to the thank you to Oliver Morrison, Public Source, and Environmental Health News, I’d also like to discuss the original Flood Commission of Pittsburgh which was touched upon at the end of the article. The original Flood Commission of Pittsburgh without question realized the importance of having someone from the press to spread their message and gain the public’s confidence and support.
The Flood Commission also had influential leaders both from business and politics that knew how to get things done. H.J. Heinz was their president. Just take a look at everyone involved on the Commission from their 1912 report:
The original Flood Commission of Pittsburgh was aware that solving this issue required a gargantuan effort from experts from several disciplines. In 2020, we need to do the same. Here’s who’s needed:
Representatives from grass roots neighborhood level watershed organizations. Many of their names and faces were in the article. These people are passionate and knowledgeable about the subject and will ensure equitable and just outcomes for all. These organizations include the Allegheny County Conservation District, Allegheny Watershed Alliance, Girty’s Run Watershed Association, Watersheds of South Pittsburgh, Nine Mile Run Watershed Association, 3 Rivers Wet Weather, Friends of the Riverfront, Riverlife, to name a few. There are likely many others that I am missing.
Leading experts that know about water related issues and land use planning. Engineers, planners, landscape architects, local academia on the cutting edge of the latest science, US Army Corps of Engineers, and the Green Building Alliance to name a few.
Business representatives from the health care, finance, technology and real-estate industries. You know, the usual suspects: UPMC, Highmark, PNC, Covestro, Greater Pittsburgh Chamber of Commerce, Allegheny Conference on Community Development, and Southwestern Pennsylvania Commission. I’d even toss in Duolingo, Google, and Facebook into this discussion as they are trying to attract the brightest minds to come and live in Pittsburgh and work for them. The region is losing millions of dollars in health costs and property damage related to flooding. Climate change projections are not exactly painting a rosy picture. We’ve just had two of the wettest years ever on record in 2018 and 2019. Are they not concerned about this issue? They should be.
Political leaders from the County and Municipalities. More specifically, leaders that are willing step up and potentially say things that may be unpopular. For example, the issue of government funded property buyouts in flood prone areas. Councilman Anthony Coghill should be praised for his willingness to speak openly in the article about property buyouts. We need more leaders like him.
Finally, members of the press are needed to help spread the word to the public.
In closing, I would like to make a call to action to all of us in 2020. I suggest that by the end of the year we revive a Pittsburgh Regional Flood Commission. And in doing so make it transparent and open to the public so that journalists like Oliver Morrison can report on the progress.
Maybe leaders at the Allegheny Conference on Community Development and/or the Southwestern Pennsylvania Commission could lead the charge? I’m not entirely sure who is the most appropriate organization with the greatest influential reach, but those two make sense to me. I hope Oliver Morrison’s article somehow inspires someone to take action.
Because if not now, when? What exactly are we waiting for? It’s a new decade and it’s time for action. As I said to Oliver and as I was quoted in the article “this isn’t going to fix itself.”
In the meantime, I’ll keep on blogging.
*Author’s note: the blog went from 20 to 30 subscribers and one of them was my sister, but I’ll take it!
“In time and with water, everything changes.” – Leonardo da Vinci c. 1513
To me, the essence of Leonardo da Vinci’s timeless artistic works was his ability to capture the beauty of movement. He was able to take a single snap shot in time and bring his subjects to life with the stroke of a brush.
Take for example, The Last Supper where it feels as though Jesus’s disciples are all in the act of doing something with great movement. Several disciples look as though they are in heated arguments and are nearing the point of a fist fight in front of Jesus. I mean, just take a close look at Jesus’s face in the scene. Doesn’t his expression just look exasperated with his closest group of friends? That’s what you get, Jesus, for turning water into wine free of charge. You get a bunch of loud drunks with one guy pointing a finger into your face when all you want to do is eat a some unleavened bread and have nice quiet dinner DURING YOUR LAST FRICKIN’ MEAL.
Or take Mona Lisa with her famous smile and her slightly squinting penetrating gaze that seems to move and follow you across the room at the Louvre along with the hundreds of tourists carrying selfie sticks. To me, forget about the actual person, Mona Lisa, in the painting. What makes the Mona Lisa the greatest painting ever is the backdrop in the distance behind her head. Just look at those mountains and the lakes and flowing rivers. It almost feels like the Earth is also moving with her.
Leonardo da Vinci also had an obsession with the movement of water and great floods. He often drew in his sketch books the beauty of moving water along with the horrors of devastating floods. Near the end of his life, he was making sketches that looked as though they were made by an insane person obsessed with the apocalypse and the Earth being consumed by great floods. I wonder if elderly Leonardo were alive today reincarnated, would he be outside of some McDonald’s in a downtown city wearing nothing but rags holding a sign on broom stick saying “The End is Nigh. Prepare.” Probably best not to think about that possibility.
Leonardo da Vinci’s water and flood sketches:
Seriously though, If you want to read up more on the life Leonardo from a more respected and authoritative source (basically anyone but me) I would highly recommend Walter Isaacson’s biography. It’s a fantastic read, as is the case with all of Water Isaacson’s biographical works. Seriously, collect and read them all. Isaacson’s podcast is great too.
The main point of this post isn’t to be an education in the life of Leonardo da Vinci. It’s about the importance of capturing the movement of rainfall so that we can better understand regional flooding.
It’s been about two months since my last blog post where I wrote about a big update to the historical flooding archives. In the time since I’ve mostly been eating and drinking my way through the holidays. But also learning new ways to capture time and movement in the rainfall flooding maps.
I’ve gotten a bunch of kind words of encouragement about the interactive flooding maps, especially the 2018 Wettest Year on Record storymap that now has over 2000 views. But the rain maps are static totals of full calendar days. Without movement, they don’t paint the full picture like in Leonardo da Vinci’s paintings and sketches. So in my spare time over the past month or so I’ve been learning to write automated scripts that capture the movement of the rainfall.
I’ve done three rainfall flooding events so far:
October 29, 2012 – The very first flooding event on the historical flooding archives. Gotta start somewhere. Might as well be the first one.
June 14, 2017 – A highly isolated severe thunderstorm that occurred in the south hills and flooded Saw Mill Run in the City of Pittsburgh.
June 20, 2018 – A more wide spread severe thunderstorm that also occurred in the south hills that caused wide spread flooding which tragically killed one woman in Bridgeville, swept another person through a culvert pipe, and required “at least 66 swift water rescues”.
And here they are…
October 29, 2012
Dark red = 0.10 inches of rainfall in 15 minutes
Pitcairn and Wall seeing residential basement flooding
As is evident from the images, the movement of rainfall provides a brighter and fuller picture of what happens during rainfall flooding events. Often, it is not the total amount of rainfall but the intensity (i.e. how fast the rain falls over time) that has the greatest influence on flooding in our region. To fully understand rainfall intensity means understanding movement and time.
I’ll be further developing the movement of rainfall maps going forward on this blog. The purpose of this post is to demonstrate the art of the possibility.
What if we took every flooding event in the flooding event archive and made these maps?
What if we calculated the rainfall intensities along with the total rainfall?
Is there a “trigger” point for when flooding occurs? Does it differ by watershed?
These are questions I have thought about a lot.
We can answer these questions. We have the rainfall data courtesy of 3RWW and ALCOSAN, it’s just a matter of understanding it better. Understanding the rainfall is the first step in developing possible solutions.
This one is going to be a quickie but goodie blog post.
This past weekend I spent a little time doing a big update to the flooding archives webpage. If you don’t know what this is feel free to click on the link. Upon viewing it should be pretty self explanatory. It’s a table that lists all of flooding events that have happened in Allegheny County in recent years. Hence the name “archive”.
Some of you may be asking: “Tom, what sort of sad life do you lead where you have time to research all of these flooding events?”
Well thank you for that question and funny gif random italics voice person, but a little something called “computers” and “automation” were invented in recent decades. But, yes, I’m fully aware that performing these activities in my free spare time on a weekend is indeed truly kinda sad. So you got me there random italics voice person. Jerk.
All of the new flooding data on the archives page is a result of the Twitter data pulled from Allegheny County’s Twitter feed. Big thanks to Allegheny County for making this information public and staying on top of the flooding. Click the link below if you missed the blog post about how I mined Allegheny County’s Twitter page for flooding data using automated scripts. “Twitter, not just for lunatics, also useful for flooding information.”
Needless to say there’s a ton of great flooding information in the Allegheny County Twitter data that I plan on using to create more blog content. None of the newly added dates have rainfall maps yet. Those will be coming shortly. Stay tuned!
Halloween 2019 broke all-time rainfall records across the Pittsburgh region. With the historic rainfall brought widespread flooding across the Pittsburgh region primarily in the western portions of Allegheny County. Rainfall totals were upwards of 2.5 inches in some places according to radar rainfall estimates. The “official” rainfall at the Pittsburgh National Weather Service recorded 1.98 inches.
Record rainfall for the day. 1.98 inches for October 31st at Pittsburgh International Airport. Rainfall for October now totals 7.20 inches. This is the 2nd wettest October on record. Most rainfall recorded was 8.20 inches in 1954.
I must say, we’ve been getting really good at breaking long-term historical rainfall records these past couple years. Making an annual habit of doing this is probably not a feather worth putting into our rain caps, however.
2018 was the wettest year on record that brought unprecedented flooding and landslides to the county. This year has been a little bit quieter on the flooding front thanks to a somewhat drier August and September. However that shouldn’t take away from the fact 2019 is only 1-inch behind 2018’s record rainfall pace. The record for annual rainfall is 57.83 inches in 2018 and currently we are at 47.28 inches.
Should we be considering these types of rainfall years the new normal? Maybe, maybe not. But many climate experts say it’s likely.
Two years in a row of breaking historical rainfall records should have us all concerned.
Welp: We got nearly 2” of rain in Pittsburgh yesterday, a new daily record for Halloween that caused localized street flooding. Over 47” so far this year, and now only 1” behind last year’s record pace. https://t.co/RYFgu3uPJp
It took until the last day of the year, but 2018 is now the wettest year on record. The final total is 57.83 inches, which breaks the previous record of 57.41 set in 2004. pic.twitter.com/BZdQENZOMr
Some of you may have been wondering why no posts for the past couple weeks. Well you need not fret no more. I’m back and ready to deliver more content to my thousands upon thousands of blog subscribers. Okay dozens. Okay seven of you. This one’s going to be a bit of a long one so buckle up, but it’s pretty epic story in my opinion. Especially if you’re into water stuff. It was a life changing experience for me, personally. A story that I felt needed a full dedicated blog post.
At the end of September and into early October I spent two weeks traveling across Europe on various trains. The trip primarily consisted of walking around looking at various old buildings and mountains and drinking only the finest, cheapest wines and beers France, Switzerland, and Germany have to offer.
While on the trip we spent four nights in lovely München, Deutschland. Or “Munich, Germany” as us English speaking folk like to call.
Admittedly, I’m not much of “research” guy when it comes to vacation planning. I tend to like to go where the wind takes me. Or rely on my amazing and wonderful wife to herd me like a farm animal in the right direction of where I should go next. Who am I kidding, it’s mostly the latter, and not just on vacations. I do appreciate the prodding, otherwise in all likelihood I’d be lost.
So when we were planning this Europe trip, my only request was a stop off in Munich for Oktoberfest and Neuschwanstein Castle. Both were great. I won’t overload you with obnoxiously envious vacation photos. That’s not what this blog is about. That’s why Instagram exists. What the hell, here’s one of me in lederhosen just to prove I was there. Hash tag, no filter.
Side note: lederhosen are surprisingly more comfortable and warm than they are described or appear. Would wear again.
Now for the main point of this blog post.
We spent one afternoon visiting Munich’s riverfront parks, network of man made canals, and flood mitigation projects. I walked away pretty much in awe. More determined for why this blog even exists in the first place. Before we get into these details I think a little background and history about Munich is necessary. Minus all the Hitler/Nazis/beer hall putsch stuff (insert nervous coughhere). I’ll just stick to water history. Thanks.
Munich Background & History
(No Nazis. Nazis suck. Water stuff only.)
Munich is located at very southern portion of Germany at the foothills of the Bavarian Alps near the border of Austria and Switzerland. See Europe map pulled from Google:
Some facts about Munich:
Has a land area of about 120 sq. miles which is about double the area of the City of Pittsburgh’s 58 sq. miles.
Has about 1.5 million residents which is nearly identical to Allegheny County’s 1.2 million.
All things considered, Munich and Pittsburgh are pretty similar in a lot of ways. Also, both cities drink enough beer to kill thousands of small pets on an annual basis.
However, there is one major difference between Munich and Pittsburgh. That would be Munich’s central river, the Isar River. The Isar River is much much smaller than either the Allegheny or the Monongahela Rivers. Maybe the nearest local Pittsburgh comparison would be the Youghiogheny River. Both rivers are roughly equal in length, but the Isar River has about double the average annual flow rate as compared to the Youghiogheny. So just imagine for a second if Pittsburgh had only one river and this river was about twice the size of the Youghiogheny. That’s about what Munich looks like. See below:
Like Pittsburgh, Munich’s main reason for existence is its location next to a river. In the 10th century, a lucrative salt trade route passed through the present day location of Munich. Humans, as always, ceased upon an opportunity to make money and erected a toll bridge across the Isar River and charged a tax to the traders passing through. Eventually the toll bridge became a stop off for traders, town walls were constructed, and about 2500 people called Munich home.
To serve its growing population and support the trade and shipping route, beginning in the 13th century Munich began diverting water from the Isar River and constructed artificial man made canals throughout the city. Lots and lots of canals. Over 40 miles of them. The canals were constructed over several centuries until about the 18th century. These canals would serve an important function in present day Munich’s water character. More on that later.
Then the 19th century happened when a little thing called the industrial revolution diverted the course of humanity. Like most cities in the western world, including cities like Pittsburgh, population saw a dramatic increase in Munich in the late 1800s as people abandoned their farms for factory work. Coal plants were constructed to generate electricity which replaced the need for canals and hydropower.
Lots of people moving into a relatively small footprint in a short amount of time without adequate preparation led to some issues. Maybe the biggest problem was Munich’s lack of adequate sanitation methods to accommodate all the new people. Clean drinking water and a sewer system to carry away foul water were lacking or non-existent. Munich’s canals and water bodies basically became open cesspools due lack of a sewer system and a sewage treatment plant. Sure enough people started getting sick and dying from water born illnesses such as typhoid fever and cholera outbreaks. Also just like Pittsburgh around that time.
So the people of Munich went ahead and filled in most of the canals or turned them into combined sewers. Hey, also just like Pittsburgh around that time.
And that brings us up to right up to the start of the 20th century. At this point of the blog article I’ll just yadayadayada over the next few decades of Munich history. Yadayadayada, Germany lost two wars.
Modern day Munich and it’s Disneyland water system
OK now that we have those unfortunate wars behind us, let’s skip ahead to modern day Munich.
Munich’s river park system and water network is absolutely freaking amazing. To me, I was in Disneyland. Except it was free and there was no one dying of heat exhaustion inside a mascot suit in 90+ degree weather. Which I guess on second thought makes it not like Disneyland at all. But you get the point, I couldn’t believe what I was seeing.
What makes Munich’s water system so amazing are three things:
Amazing Water Thing Number 1: The Remaining Canal System and the English Gardens
Here’s a map taken from wikipedia of Munich’s remaining canal system. The remaining canals are shown in blue and abandoned/filled in ones are shown in purple.
Water for the canals is diverted from the Isar River here (Canal Intake 1 shown on map – see the side canal going to the upper right of the screen immediately in front of the white apartment buildings) and here (Canal Intake 2 shown on map – notice the grates in the side of the wall where water enters underground). Water from these two points then travels north underground through the heart of Munich for a couple miles where it eventually reappears near the palaces at Hofgarten and cascades down into the English Gardens at this great little waterfall where if I lived in Munich I would likely sit every day and picnic. Here’s my super awesome wife posing in her Dirndl for a photo at the waterfall.
I know what you are thinking. Tom did you get prior clearance from her to post this photo to the blog? My response to that question would be: Are you insane? Of course. I may be clueless when it comes to the female sex but I know when to not put my life in jeopardy.
From there the water heads down to this great little pond that has a small island with a freaking Japanese Teahouse at the center. Below is a gallery of some photos of the pond and the surrounding canal streams.
Finally, one cannot mention the English Gardens without the urban surfing. As mentioned earlier, the canals were originally constructed for hydropower, so as a result there are some pretty crazy artificial standing waves and waterfalls within the park. Below is a 20 second video I took of the surfers. You can also google “Munich Surfing” and read tons of articles about surfing in the middle of 1.5 million person city center and the pros and cons that come with all that. From my limited research on Munich surfing, I get the sense it’s been a bit of a blessing and a curse for the city with respect to safety and idiot tourists especially around Oktoberfest time.
Eh, no comment.
Amazing Water Thing Number 2: The Isar River Banks and Flood Protection Projects
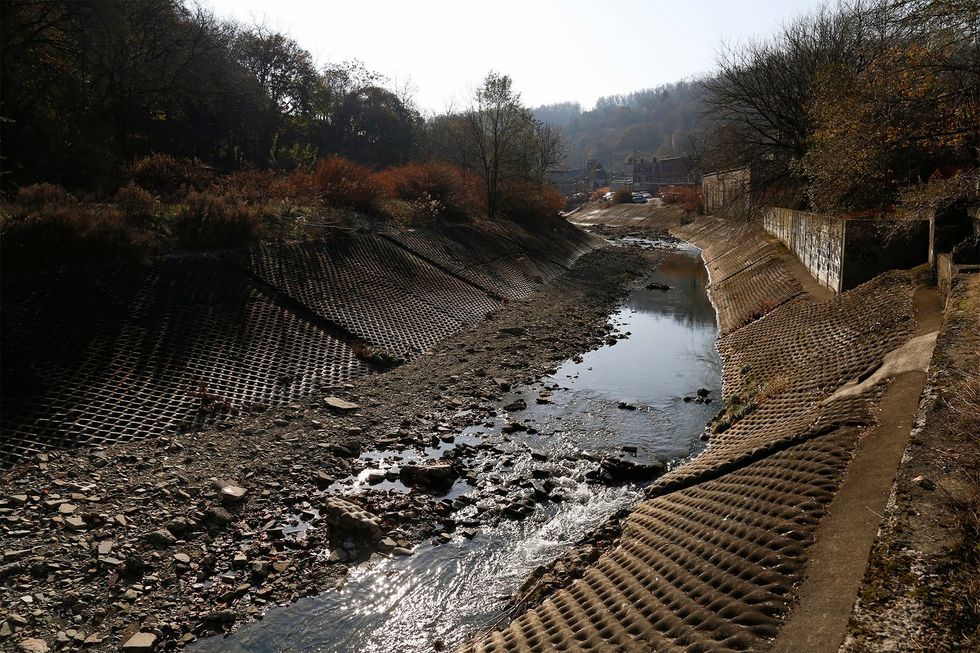
One thing I did not mention in the history of Munich is how in the 1800s the Isar River was purposely engineered within a concrete channel. This was done to make sure that the Isar River would stay in the same place year after year so that the river would be more “predictable” in its location. Although the river may be more stable in its location, this resulted in increased flooding in the City because now the flood plains are removed. The water when it gets high after it rains has no where to go except stay inside the man made channel.
If there’s one thing this blog promotes first and foremost, it is that flood plains should be protected from encroachment and development. Flood plains are there for a natural purpose and should not be developed within or touched under 99% of circumstances. When rivers and streams inevitably rise during large storms, water needs a place to safely disperse. That is the primary function of a flood plain. Without them there are problems, especially when it comes to flooding. For a good local Pittsburgh example, see Saw Mill Run. The flood plains in Saw Mill Run are now occupied by used car lots and self storage unit buildings. The stream has been completely restricted inside of a mostly man made channel. Both of these conditions make for a bad recipe for increased flooding.
Munich over the past few decades has taken on a grand challenge (see this blog’s first post) and has developed the Isar Plan. The plan sets out to correct past mistakes with respect to the Isar River and its flood plains.
As part of the plan, the City of Munich in partnership with several German government agencies and local citizen groups are taking on a complex problem together. The plan calls for restoring the Isar River by re-creating the flood plain banks and removing the channelization. Below is a great time lapse video of the construction process in action for a section of the Isar River in the city center of Munich. Essentially, the machinery in the video are pulling down the concrete channels and allowing the River to “breathe.” And what makes this video even more awesome, is that an actual flood happens about halfway through the video! It gives you an idea of how the process of flood plains actually work. It’s one of the best videos on restoring natural flood plains I’ve seen.
Amazing Water Thing 3: The Isar River’s High Water Quality
The Isar River has very good to high water quality most of the year. So good in fact that most of the river is used by residents for swimming and bathing in summer months. Also surfing! And public nude bathing. Don’t knock it until you try it. It’s European! Sorry no pics. Will not send nudes.
Below is a photo taken this year in July 2019 in Munich during the record heat waves that spread across most of Europe.
Here’s another more interactive location of a popular spot near the Marianne Bridge. And another a little further upstream. And another near the Deutsches Museum.
You get the idea. Pretty amazing huh?
But how is the water so clean? Munich has 1.5 million residents (more than Pittsburgh), is highly developed (just like Pittsburgh), has a combination storm and sanitary sewer system (just like Pittsburgh), and gets a lot of rain every year (just like Pittsburgh). Shouldn’t Munich have the same combined sewer overflow issues?
The reason is because Munich captures and prevents most of its combined sewer overflows in 14 massive underground storage basins scattered throughout the city. These things are gigantic. Below is picture of one under the Hirschgarten, a city park located in Munich.
I liked this description of the basins taken from this article:
“The dimensions, reminiscent of the Moria Mines of the Lord of the Rings trilogy, are gigantic: 200 meters long, 60 meters wide, six meters high. Directly below is a second pool. It’s even bigger.”
Converting from meters to Murican Freedom Units that’s roughly 650′ by 200′ by 20′. And there’s two of these directly on top of each other. And this is just one of 14.
Below is an animated video of how the basins work. Note: there is no sound on the video, so you will just have to go to your kitchen and run the faucet while you watch the video to mimic the background sound of running water.
Here’s another great article I found, stating that these are the likely the largest underground stormwater basins in Europe, if not the entire world.
So there you have it. The land of Munich and it’s Disneyland like system of amazing water things.
Some of you may be saying to yourself, “Tom, what’s the point of all this? We can’t do this in Pittsburgh.”
And to that I say “Nonsense. All of this is possible.”
There’s no reason why Pittsburgh can’t be Munich. We really aren’t all that different, as discussed throughout this post. It will take time, no doubt. But we can do it. There’s examples all around Pittsburgh of people trying to make it happen. Watch this video of Saw Mill Run for example.
Flooding is a problem in our region and Allegheny County. Check out my previous blog post to get a sense for how much it’s a problem.
But it’s a national problem. Make no mistake about it, most of the nation has a flooding illness. Our region is by no means alone in combating its flooding struggles.
For example, check out this national report from Texas A&M and the University of Maryland:
Wait a second, just one moment. Before I continue with the report, I’d like to pause and take this moment to comment on “blue coat kid” aka real-life Dennis the Menace on his bike above. In case you forgot, here’s a friendly reminder by my favorite twitter feed Allegheny County:
Seriously… Do NOT drive through standing water. Not only are you placing your own safety in jeopardy, but also those of those who must respond to rescue you.
Although not specifically mentioned, this tweet also applies to adolescent children driving a bicycle. Yes, even when under “adult supervision.” That’s right, I’m talking about you “red coat basketball shorts” guy standing in ankle deep water watching your child drown. Dear lord, get your freakin’ kid inside and out of torrential flood waters! Don’t just stand there! Your child looks like he’s literally stuck in the middle of a flood. I know you are probably fed up with him playing that dang Fortnight game for endless hours, but now is NOT the time to get his “butt outside” during a flood!
Alright now that I’ve addressed that, let’s move on to the report itself. Here’s the link if you care to read the report. But as promised, I’m going to summarize this bad-boy (aka blue coat kid) here on the blog.
The report has ten main conclusions, which are summarized below in my own words with added commentary from myself, David Letterman, and Paul Shaffer in italics. I should note that the actual authors of the report didn’t rank the ten conclusions in terms of importance. But I’m going to present them in the style of David Letterman’s top ten list for no good reason other than I really like David Letterman.
So here we go…
For tonight’s Top Ten list we have “Conclusions from the national flooding report: The Growing Threat of Urban Flooding : A National Challenge “
At Conclusion Number 10: Data on flooding is not easily available.
Tom Batroney: Could not agree more, we need to record and document our flooding problems every time they occur which is why I created this blog and the flooding archive.
Conclusion Number 9: Homeowners are ill equipped to protect themselves from flooding and many lack resources to do so.
Conclusion Number 8: Government has done a poor job educating the public on flood prone areas, keeping flood maps up to date, and officials generally don’t like to talk about it.
David Letterman: Hey Paul, number 8 reminds me of that time you and I went on that week long bender in Vegas. I’d really prefer not to ever talk about that as well.
Number 7: There are economic and social inequities with flooding and that are not well understood. Low-income populations are particularly vulnerable.
Number 6: There is no government agency at the federal level charged with oversight of urban flood reduction activities.
Number 5: The condition of drainage systems across the nation are in poor condition and are in need of support.
David Letterman: Yikes, pretty sure there’s a prostate exam joke in there somewhere.(David pulls at shirt collar uncomfortably, takes a sip from his mug reluctantly, hinting that it’s David with the prostate problem)
Number 4: No one wants to take responsibility for flooding and there is a lack of coordination to address political challenges.
David Letterman (dripping with sarcasm): You know, Paul, call me crazy but I just have a really really really good feeling lately about Congress and their ability to come together and overcome our political challenges.What do you think? Don’t you think so? (long awkward pause – camera pans to Paul shaking his head in disbelief)
Tom Batroney: BULLSEYE NUMBER 4. See this blog’s very first post.
Number 3: Solutions are best developed at the local level. While federal support is needed, leaders at the local level must take ownership.
Tom Batroney: Again, see this blog’s very first post.
Number 2: Storms are becoming stronger and more frequent due to climate change. The flooding problem is only going to get worse if we don’t do something.
David Letterman (talking purposely aloof): Paul, have you heard about this so-called “Climate Change” (David with hand air quotes) issue? Craziest thing I tell you. Apparently there are all these science experts out there, something like 99.999% of them, that say us humans are destroying our planet with the burning of fossil fuels and the earth is getting warmer because of it.
Paul Shaffer: David, what’s the climate like living under your rock?
And tonight’s number 1 conclusion……..
Number 1: Urban flooding is a growing source of economic loss, social disruption, and inequality to our country. The growth in urban flooding is being caused by:
extensive suburban development,
aging infrastructure,
lack of maintenance of our drainage systems,
climate change, and
a lack of coordination at the local level.
Tom Batroney: The last point in my opinion is the single most important factor. If we don’t start to coordinate at the local level within Allegheny County, it will be very difficult, if not impossible to address our flooding problems. We must come together if we are going to have a chance.
I like to compare the experience of surfing Twitter to the outbound lanes of the Fort Pitt tunnel. When you get down to it, Twitter is a lot like trying to jam four lanes of 50 mph highway traffic into a two lane hole. We are trying our best to make this situation work smoothly and calmly as possible, but there is only so much anyone can do when four lanes come together into two like this. Same goes for Twitter, there’s only so much we can do with condensing our minds into 280 characters. This is why Twitter is mostly a raving lunatic asylum. It’s the 365/24/7-at-4pm-on-a-Friday-outbound-lanes-of-the-Fort-Pitt-tunnel of internet experiences.
But every so often there will be a small shining ray of light flickering on Twitter. A ray of light that gives you hope there is reason for all of this insane madness. Kind of like that guy, who looks a little bit like your Uncle Bill, waiving you in with a nice warm smile from his shimmering silver 2007 Honda Civic. Thank you, and here’s a waive back to you, Uncle Bill.
Especially when it comes to local flooding reports.
During many of the past flooding events in our region, Allegheny County’s twitter page was on top of things posting helpful information to the public. For example, here’s a random flooding tweet from back on June 10, 2018 from Allegheny County:
Pittsburgh/Whitehall: Rte 51/Saw Mill Run Blvd closed for flooding between Library Rd & Provost Rd
This tweet is super useful. It contains specific location information along with a date and time.
So a month or so ago, I wondered to myself: would there be a way to extract all of Allegheny County’s +17,000 tweets dating back from 2012 and filter out just the ones pertaining to flooding?
I’m an engineer (no, I don’t drive trains).
I know programming and automated scripting (a little).
I’m pretty smart (on occasion).
I think I can figure it out (or I can give up and not write this post).
Good news, I did eventually figure it out (which is why I am writing this post.)
Using automated scripts, I managed to “scrape” all of Allegheny County’s public twitter page and filter out all the ones where the word “flood” occurred somewhere in the text of the tweet.
That line above and below? That indicates where I take things to another level of nerdery. Be forewarned, beyond this point there are numbers and charts and graphs and “analyses” that experts from People Magazine say make engineers the most sexy and desirable profession on the planet.Or least, I forget which.
Graph 1– How many flooding tweets has Allegheny County made since 2012?
The answer is 535 tweets.
Here’s all those tweets in graphical format:
Observation: Noticeable increases are shown in the summer. June and July seem to be the worst months for flooding in Allegheny County.
Graph 2 – How many individual days did Allegheny County tweet about flooding?
The answer is 149 individual days. In other words, between 2012 and August 20, 2019 (when I extracted the tweets) there were 149 calendar days when Allegheny County tweeted about flooding happening somewhere.
Here are all those dates (summed by month) in graphical form:
Observation: 2018 was the wettest year on record, but the single month with the most days with a flooding tweet was back in July 2013 with 11 total days. Over a 1/3rd of the total month!
Graph 3 – On average how many days per year does Allegheny County tweet about flooding?
The answer is 18.6 days per year.
Here are all those flooding days (by year) in graphical form:
Observation: Allegheny County will tweet about a localized flood anywhere from two weeks to upwards of a whole month every year! In 2018, over 10% of the days there was flooding happening somewhere in Allegheny County.
Graph 4 (last one, I swear) – Which months are the worst for flooding?
The answer is June and July (in a neck and neck race).
Here’s the number of flooding days between 2012 and 2019 (by month) in graphical form:
Observation: When it’s June and July in Allegheny County head for high ground when it rains hard.
BONUS ROUND!!!!
Out of its 17,000+ tweets, what is Allegheny County’s #1 most liked tweet of all-time?
At 137 likes on July 21, 2019 this tweet currently sits at #1:
Seriously… Do NOT drive through standing water. Not only are you placing your own safety in jeopardy, but also those of those who must respond to rescue you.
Firstly, before we get to the subject matter at hand.
I’ve received many heart felt positive reactions from close friends and colleagues since I launched this blog a week or so ago. Many of these folks are individuals I’ve met over the course of my career in which I have a great deal of respect and admiration. I really appreciate all the words of encouragement – it gives me confirmation I am heading down a worthwhile path and maybe I’m not alone in some of my concerns and frustrations. I really appreciate all those kind words. You know who you are!
Back to the blog.
The first blog post retelling the history of Pittsburgh’s flooding challenges is just the beginning of many great things to come in my mind for this blog. Here’s a smattering of the thoughts that I have rolling around upstairs:
Guest blog articles – I’m currently working my way through my personal rolodex recruiting guest blog writers to help produce content for the blog. Well my “metaphorical rolodex” in my brain, not an actual rolodex. I mean do they still even make physical rolodexes? Furthermore what’s the plural of “rolodex”? Rolodexi? Google is recommending that I capitalize the “R” in rolodex for some strange reason. Is there a person named Rolodex? Is he/she a former Bond villain? So many questions. No, I will not capitalize “rolodex”, sorry google. BTW if you’re in my metaphorical brain rolodex and haven’t heard from me yet, you will probably see an email from me soon asking if you’d be interested in writing an article for the blog. If you are reading this and you are uncertain if your metaphorical index card is in my metaphorical brain rolodex and would be interested in writing an article feel free to contact me at pghflood@gmail.com.
Literature reviews and summaries of complex studies – There are a tons and tons of great websites, papers, articles, videos, flyers, pamphlets and betamax tapes (just kidding) out there on the web related to all things flooding. It’s a national problem, not just a Pittsburgh one, in case you’ve been living in hibernation over the past couple years (lucky bastard – BTW don’t ask who’s president). This blog will bring those resources to your attention as I come across them. I will also read them and summarize them for you so you don’t have to read like a thousand pages of dense scientific research with all kinds of graphs and charts. I will also try as best as I can to explain them in plain language, not PhD level speak gobbledygook (big thumbs up to google on that spell check – sorry for speaking negatively about you earlier, google). I will then archive them in a library for everyone to easily access for future reference. If there’s a flooding related study or paper you would like me to read and publish a summary on the blog send it on over to pghflood@gmail.com. I’d love to read it.
Pittsburgh centric maps and flooding analysis – I’ve got a bunch of mapping analysis in my back pocket (again metaphorical) that I plan on unveiling on this blog. I love working with numbers and making them into maps that people can visualize. It’s probably my number one favorite hobby. Don’t laugh at me, no really stop it. I plan publishing those maps here on the blog as I finish them. The rainfall and flooding maps archive will continually be updated, as always. For the six of you that like maps and data as much me feel free to contact me at pghflood@gmail.com. Let’s make some maps!
Whelp, that’s all I got for now. Keep checking back or subscribe your email address to this blog to get automated notifications directly to your inbox.
P.S. Time between posts at the onset of this blog might be a bit sporadic as I work towards putting together a solid backlog of blog posts. Please be patient, I know you have a salacious appetite for flooding information, but I am only one person.


